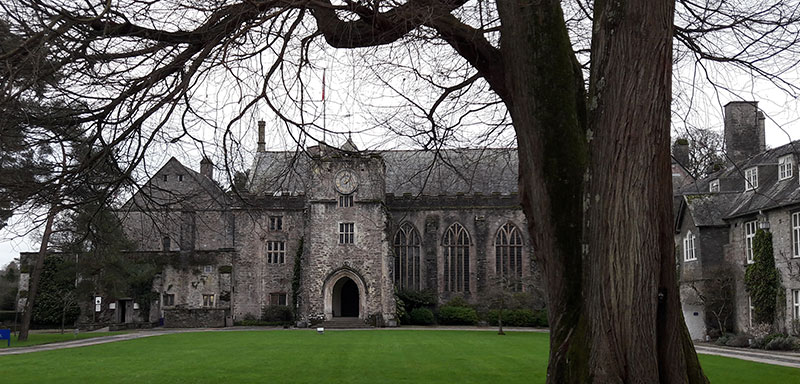
Over a fresh, sunny three days in early January, I joined 17 academic writers at Dartington Hall, Totnes for a writing retreat. What is a writing retreat, I hear you ask? Well, for academics working at a university, one of the key ways of conveying findings from their research is by writing papers that are published in academic journals. Writing these papers (often 5000 – 8000 words long) is a very time intensive task and also often key to promotion up through the university structure.
Writing a paper can be a lonely task and is often something that gets pushed down people’s to do lists, because usually there are no specific deadlines, other than the ones you invent yourself (which are easily changed!). At the session we had participants with a range of experience, from PhD students writing their first or second paper, to experienced academics writing their thirtieth paper!
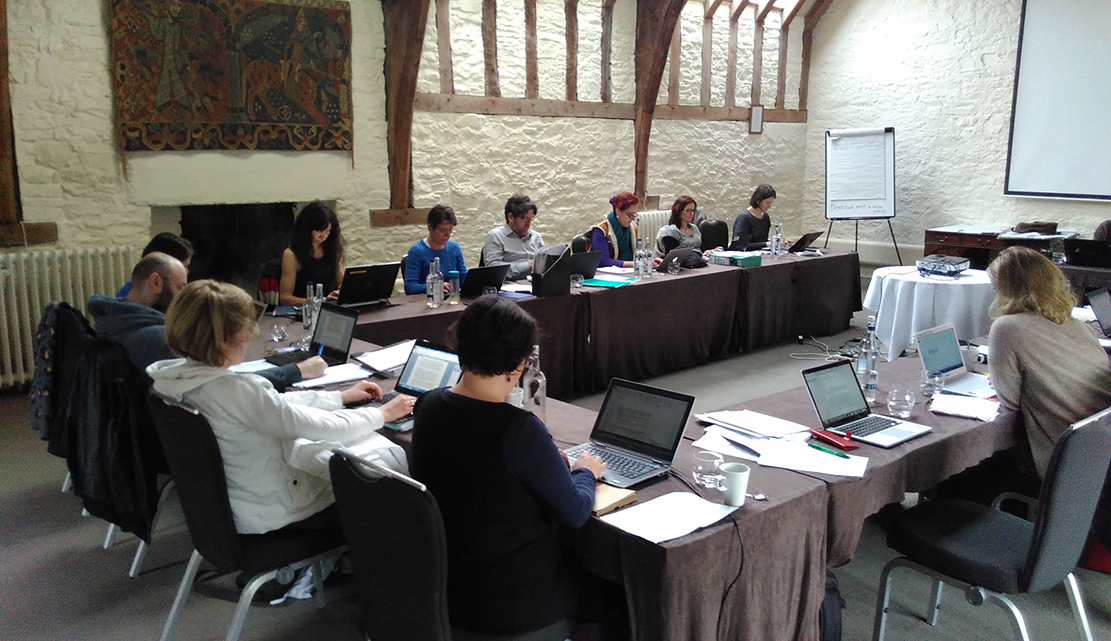
We used the opportunity to support each other by sharing ideas about writing processes, where to start and how to make the best use of the time available. We also had dedicated writing sessions (either 60 or 90 minutes) where we worked in the same room on our individual papers. This was a very new experience for me, and the “peer” pressure of everyone else writing (and not checking emails, Facebook etc.) for a specific period worked very well.
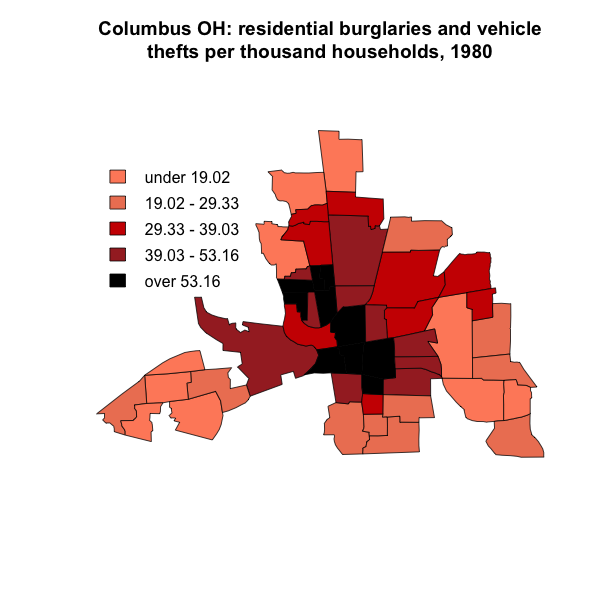
I was writing up an article on how we can ensure research is reproducible, using our recent PopChange project as an example. I hope to be presenting the research at the GISRUK conference in Manchester in March and will be submitting the paper for publication soon after!
My thanks go to Sarah Dyer and Dave Simm of the Higher Education Research Group for the Royal Geographical Society who organised the writing retreat and made sure everything ran to plan.
Cross-posted from http://www.clearmapping.co.uk/our-blog/item/475-herg-writing-retreat-at-dartington-hall.html


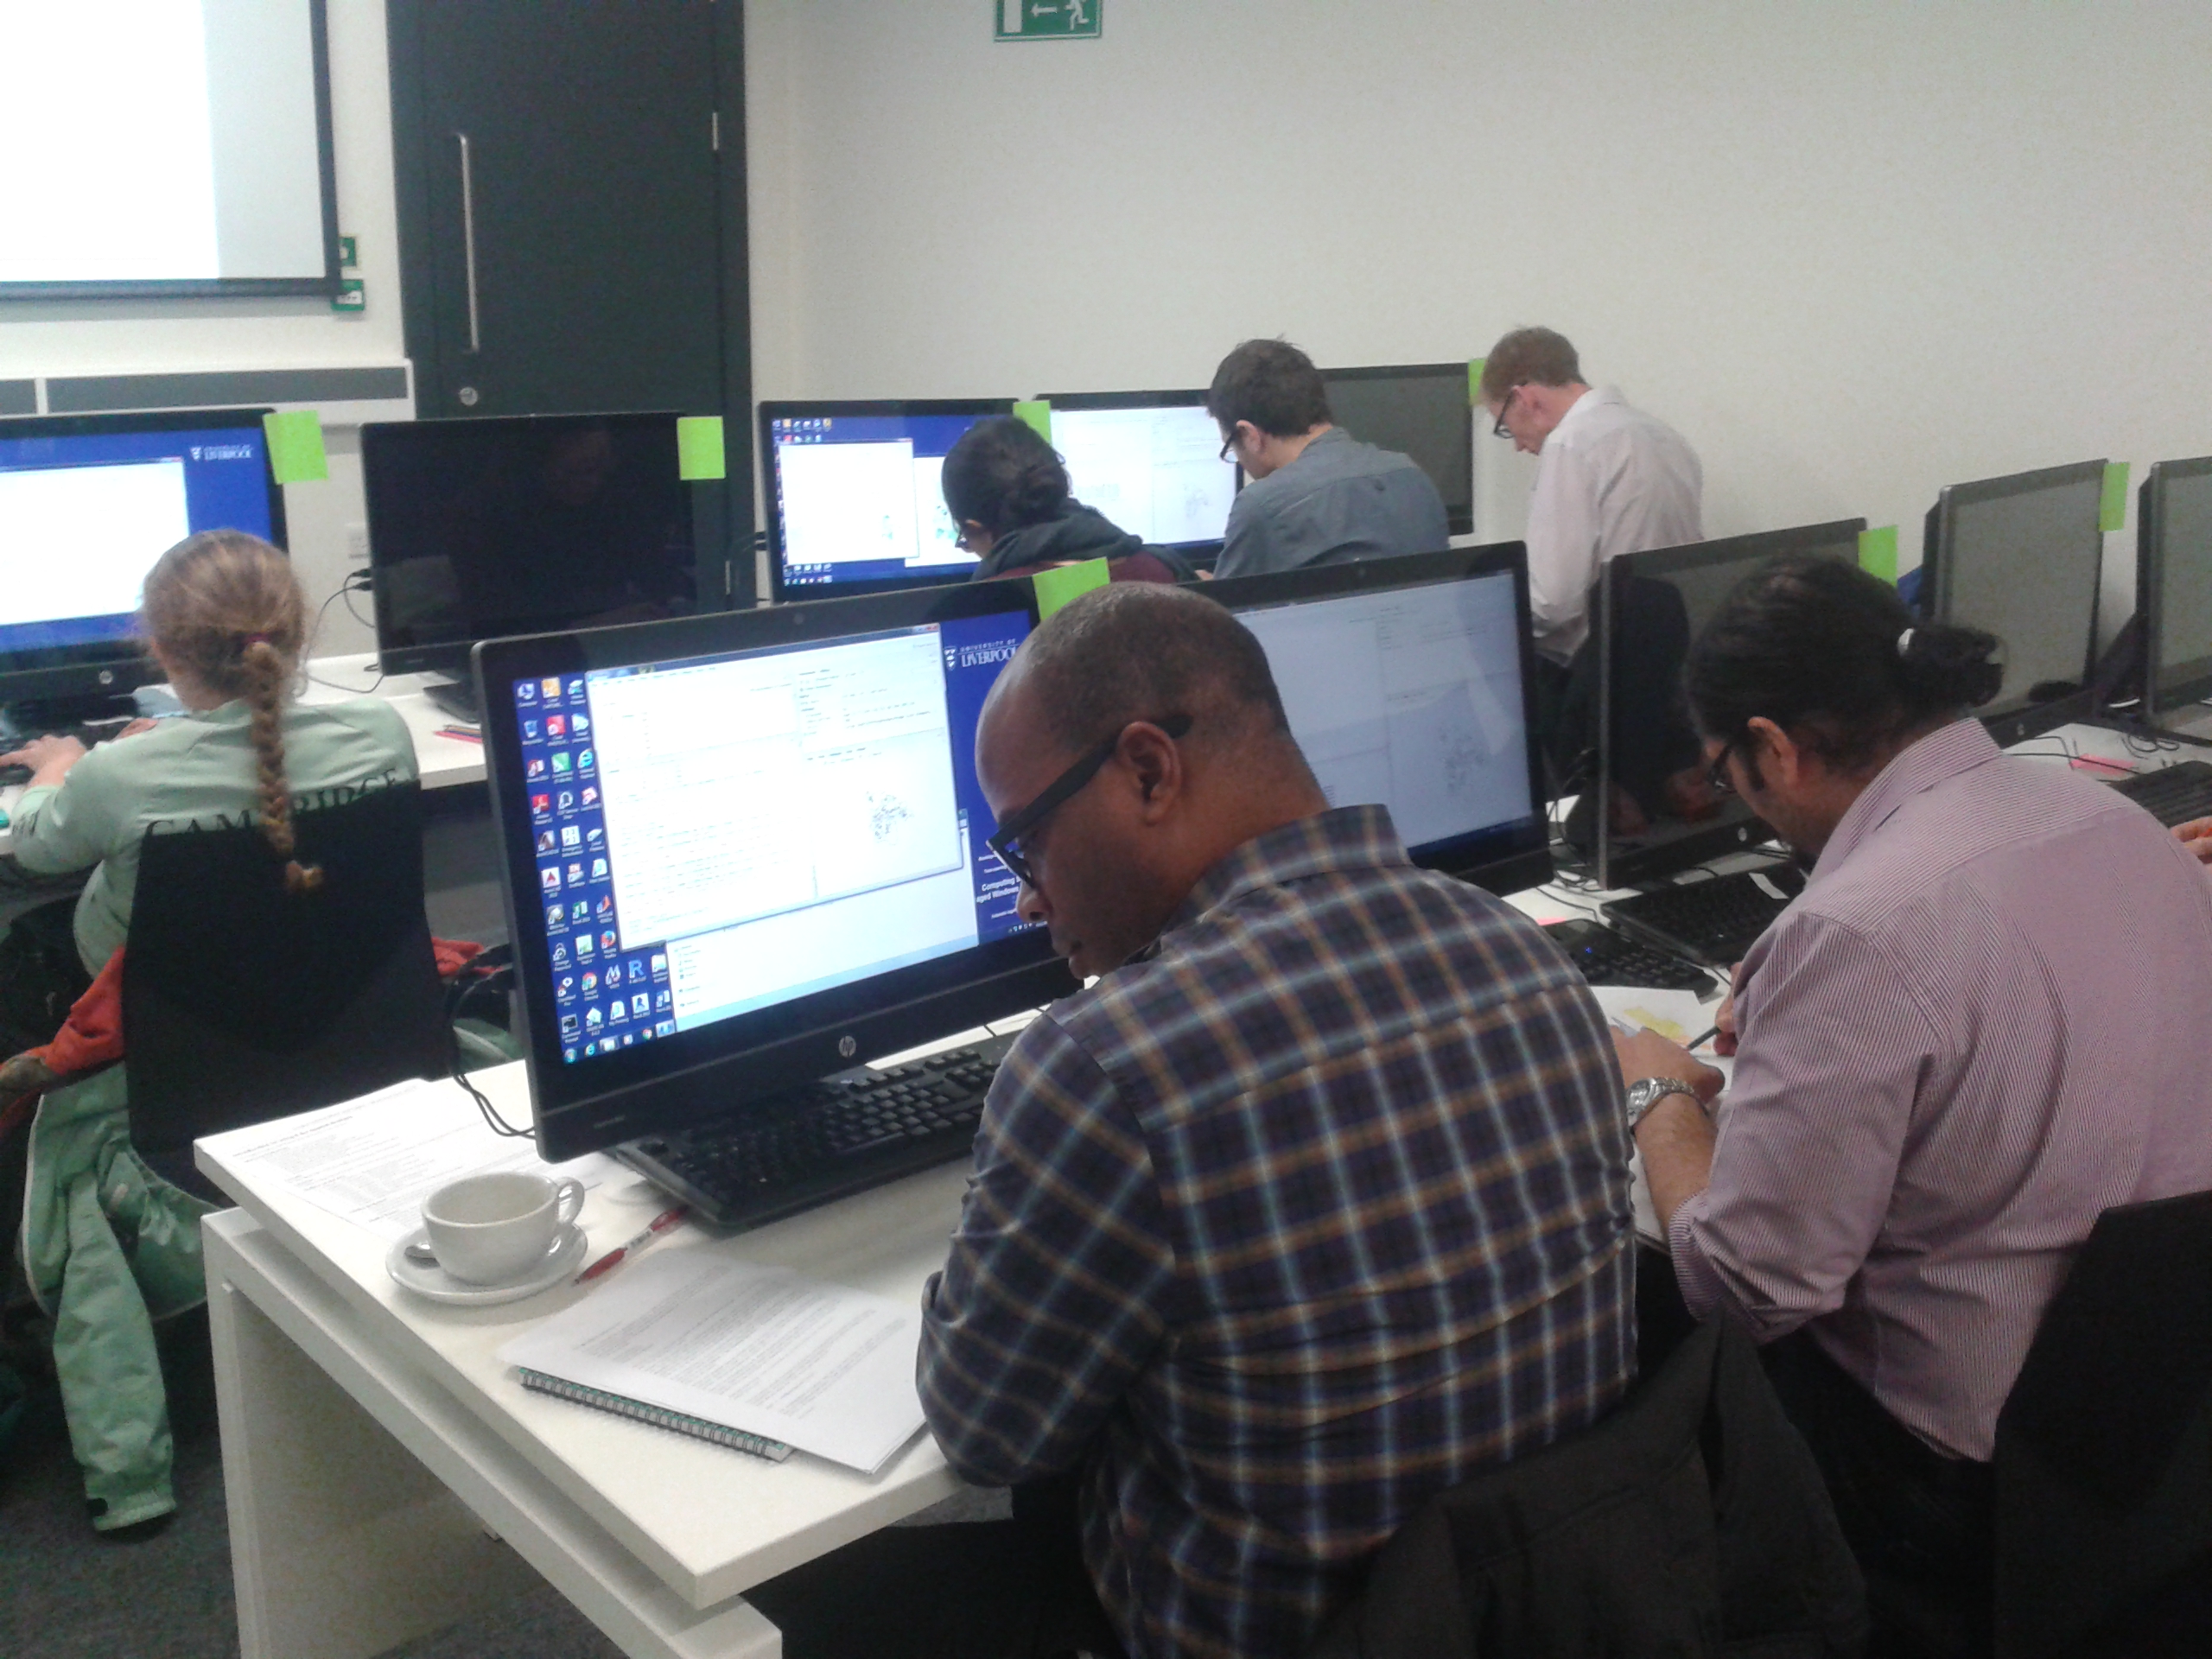
 We covered the basics of using