Sunny London: Linked Data & ESRI

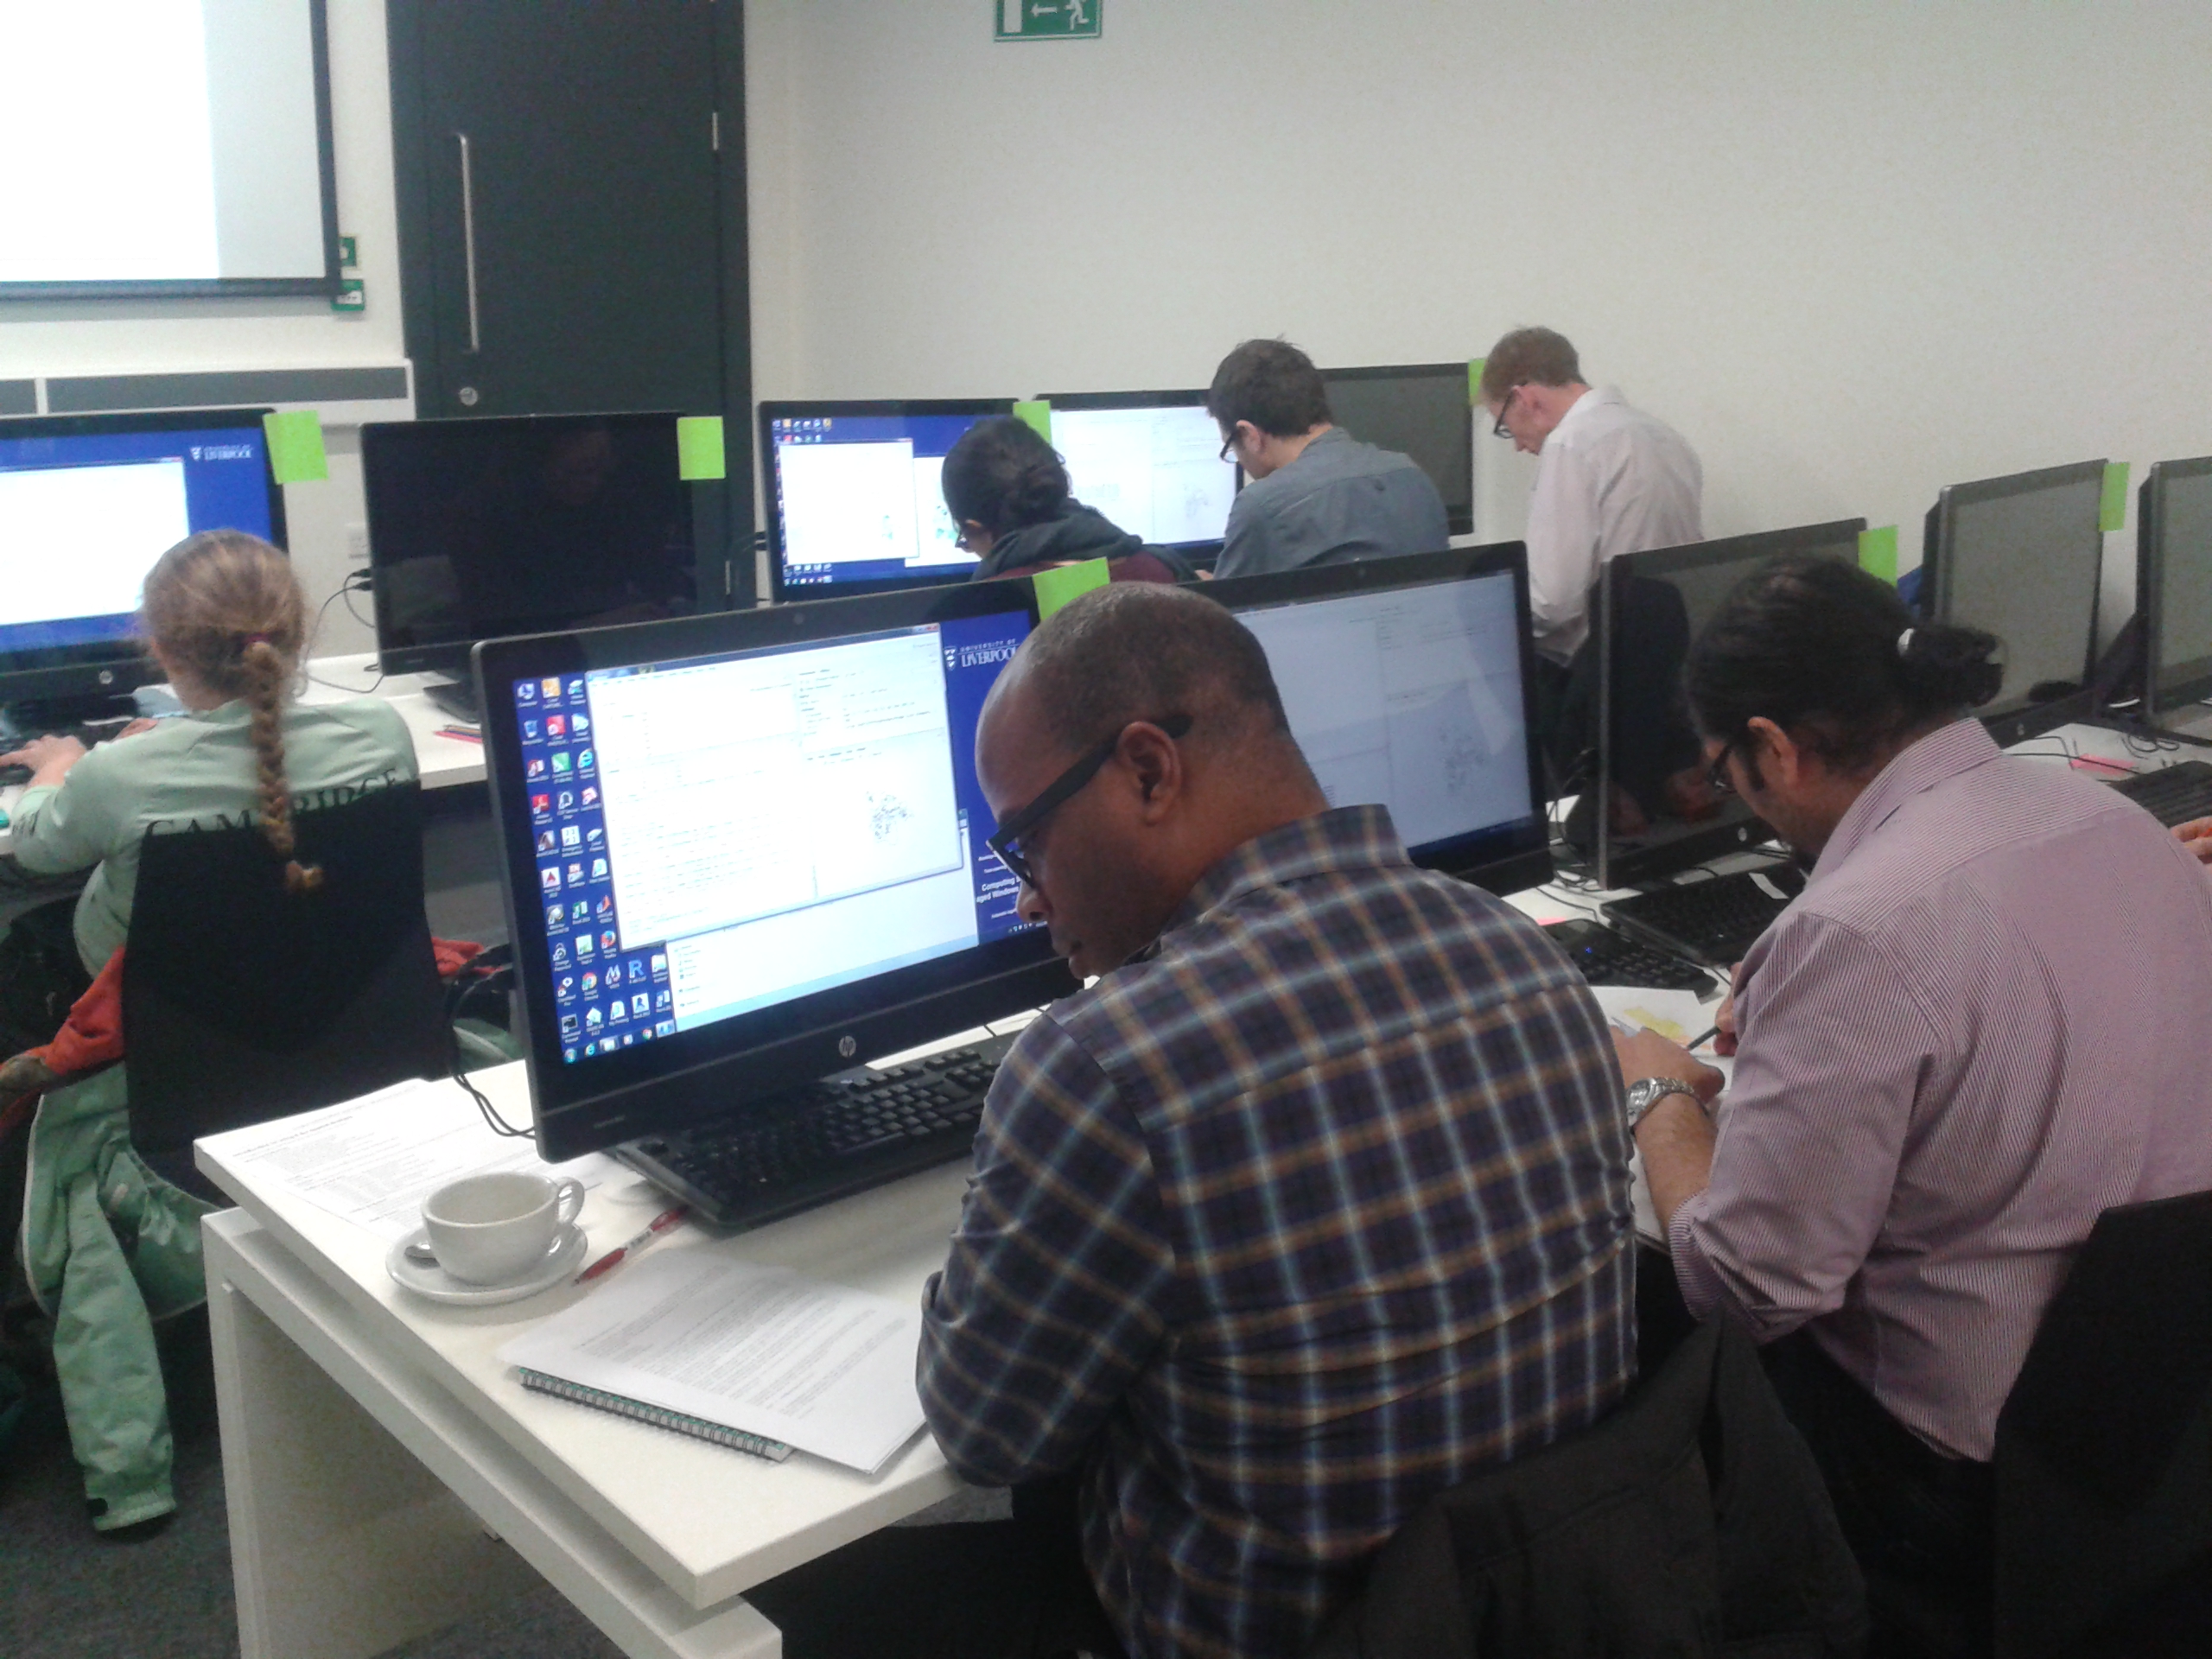
Earlier this week I have a very nice couple of sunny days in London attending a training course and a conference. It’s a nice change to attend a course (rather than delivering one!) and is also a great opportunity to add to my CPD log (particularly important for my Chartered Geographer status with RGS-IBG).

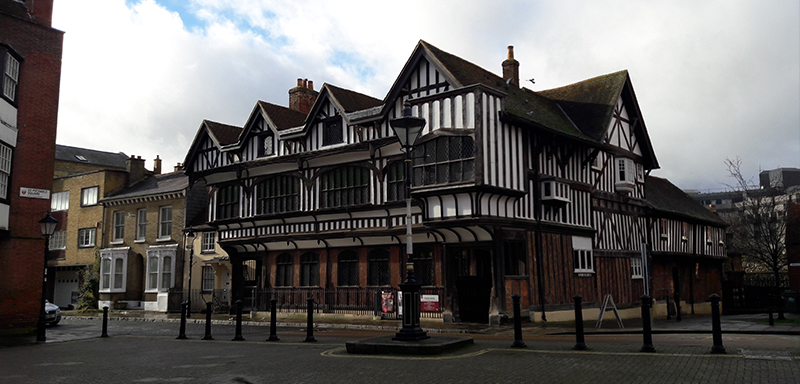
Some of my transport around London!

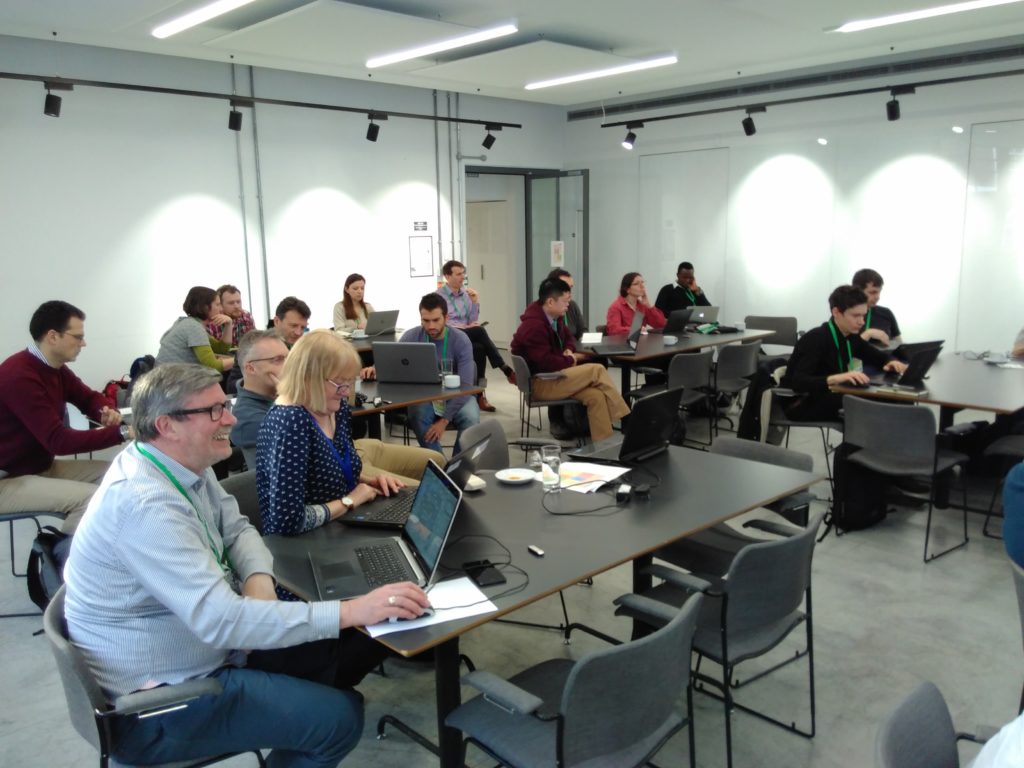
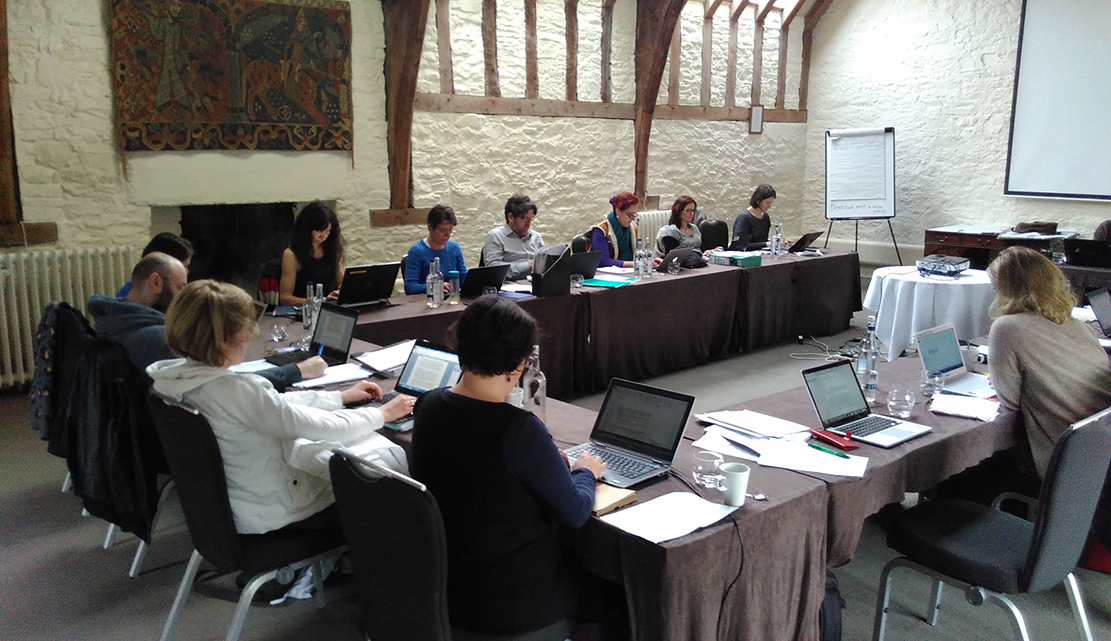
On the Monday I attended a half-day workshop on Linked Data, organised by Dr Claire Ellul at UCL and run by Bart De Lathouwer from the Open Geospatial Consortium. I’d come across the term linked data in various different situations, but hadn’t really done much with it, and this was a great opportunity to learn about it. The key bit about linked data is that it is solely formed from triples, sets of three, in the form “subject, predicate, object” such as “The pool – is – blue” or “student – name – value”. It also is a fundamentally different way of structuring data from a “traditional” relational database and so avoids many of the limitations, but also requires a completely different way of thinking about the data. This is quite a jump from what we are used to, and I think it will take a little while for linked data to properly take off. This is a good resource (http://www.opengeospatial.org/blog/1673) for some information on how OGC are working with Linked Data.

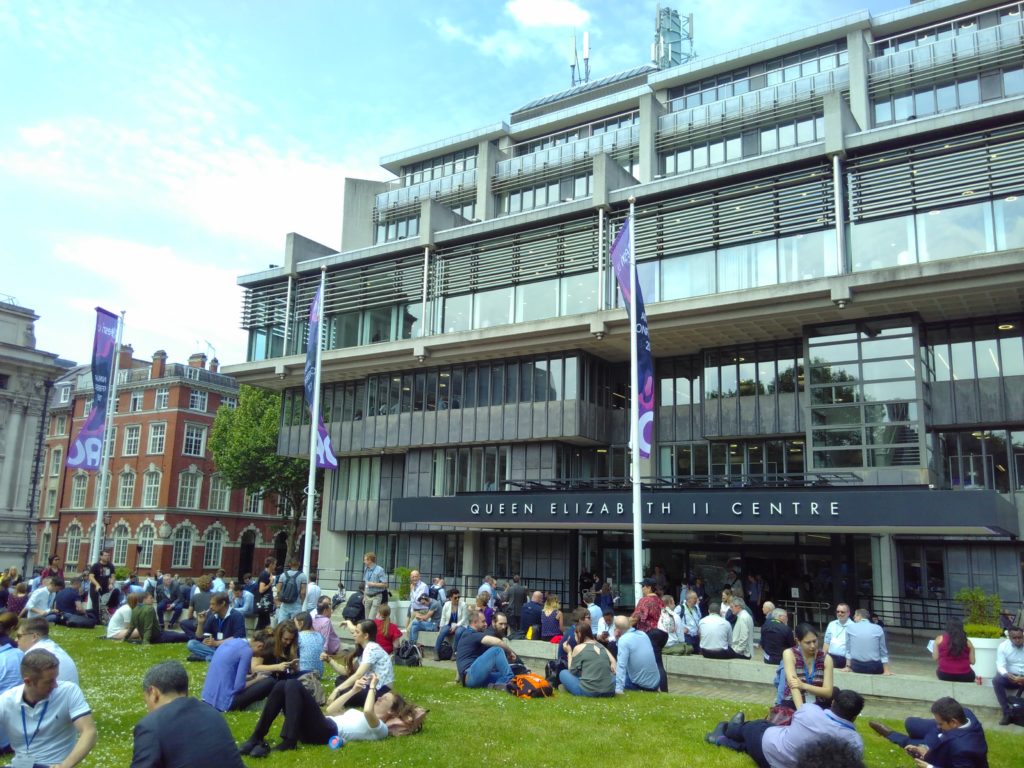
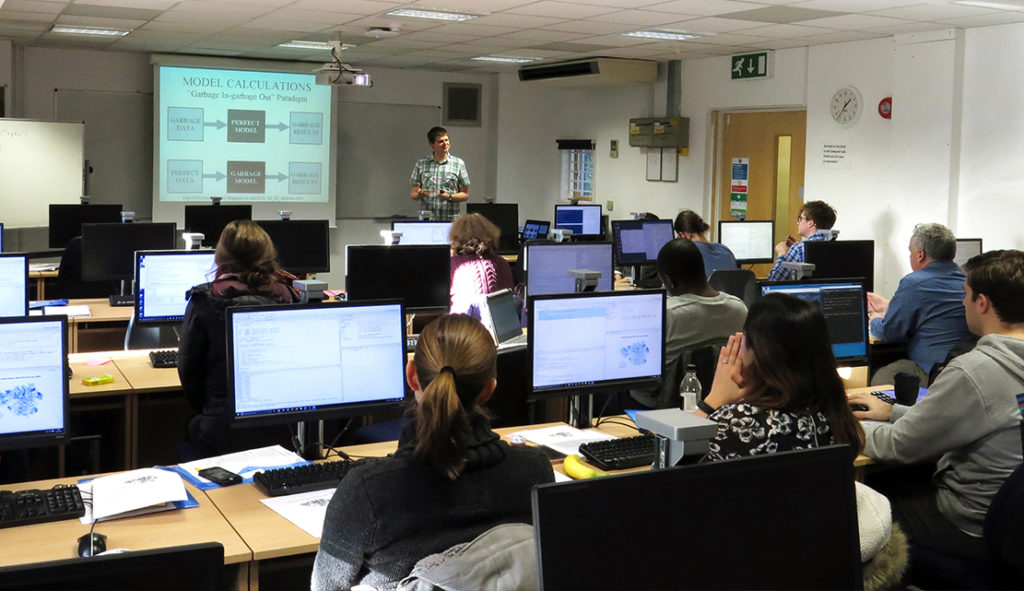
Queen Elizabeth II Centre, home for ESRI Annual Conference

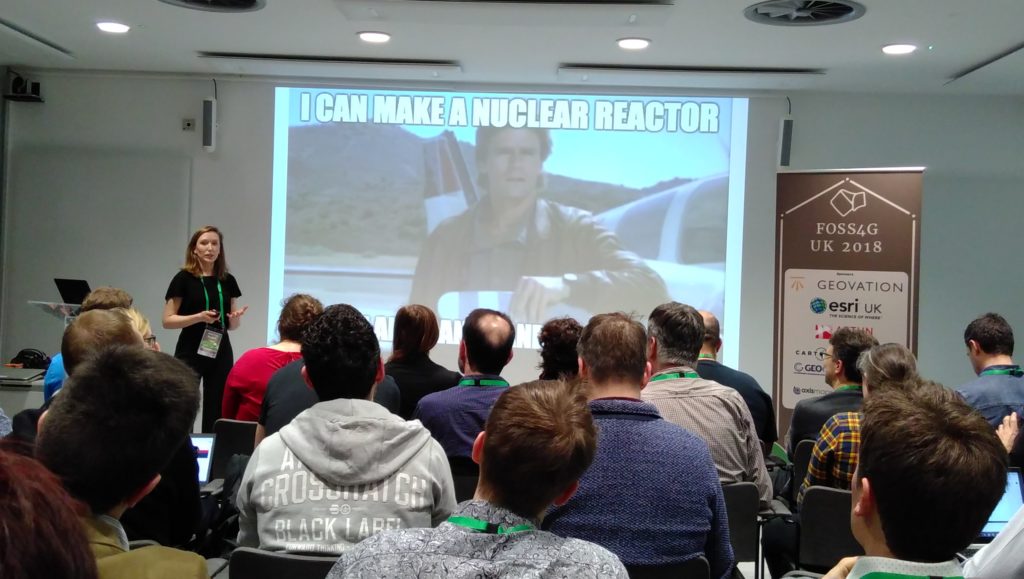
On Tuesday it was ESRI UK’s Annual Conference, based at the Queen Elizabeth II Centre near Parliament. It was a great conference, with a massive range of examples of how ESRI’s various different products could be used. There were some great examples of using Strava data to help Jersey understand cycle route usage across the island; using this data to identify and remove bottlenecks in their infrastructure. We also had a presentation on how City Engine was used by Disney to help them develop the city behind the film Zootropolis (2016), allowing them flexibility to create and tweak a whole city design with limited time and resources.

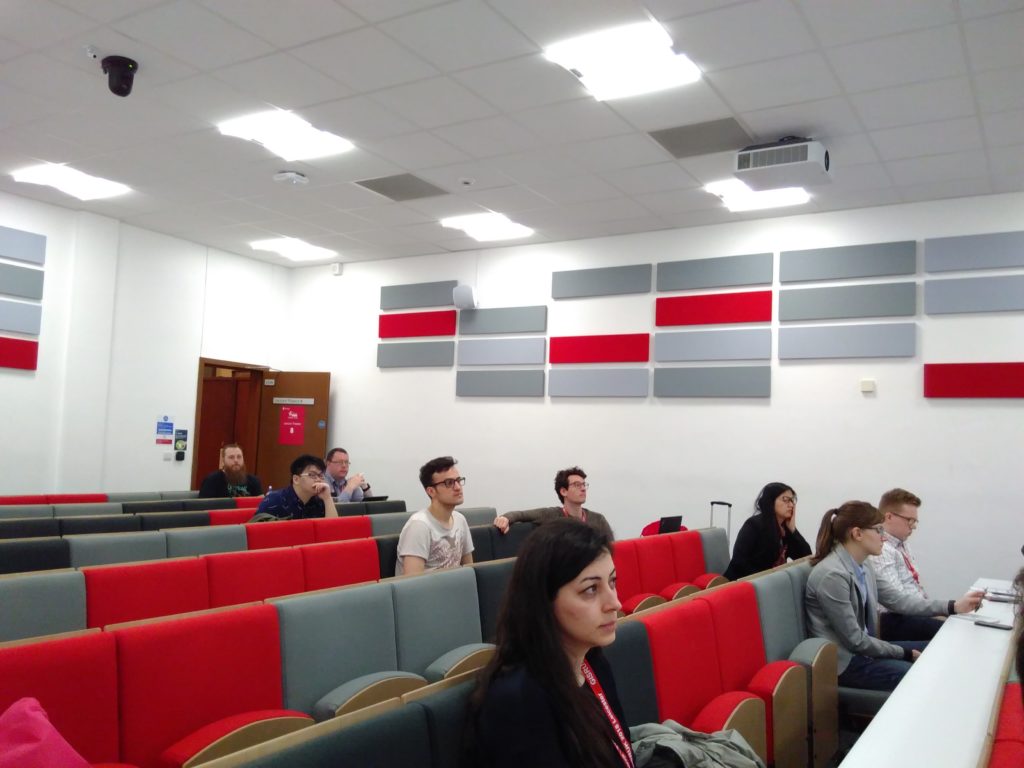
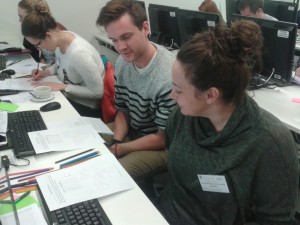
A good turn out for the conference!

Unsurprisingly a significant chunk of content was on conversion from ArcMap to ArcGIS Pro, their new flagship product. There is a big focus around users having an identity and using this to both access local and remote resources for ArcGIS Pro (including, no doubt, an element of licensing). There was also a reasonably strong theme about pushing out GIS to non-GIS users, and making it easy to use for new-comers, particularly with the development of ArcGIS Pro which, for example, automatically includes a base map when you start a new project. Possibly not ground-breaking for regular users of GIS, but a big help to someone coming to GIS cold – now they have a map they can add their data to, rather than just a big blank space (when you start ArcMap).

If you would like a chat about getting more from your GIS (ESRI or other packages!), or GIS Training for small groups, please do email nick@geospatialtrainingsolutions.co.uk or give me a call on 01209 808910.

Cross-posted from http://www.geospatialtrainingsolutions.co.uk/sunny-london-linked-data-esri/.

GISRUK 2018: A Return to Leicester

Last week I attended an amazingly sunny GISRUK (Geographic Information Science Research UK) conference in Leicester. I have fond memories of Leicester, as I completed my BSc Geography (2003-2006) and MSc GIS (2007 – 2008) there. Much of the university and city has changed, but an amazing amount is still the same – both in the Bennett building lecture theatres and certain well frequented take-aways!

University of Leicester – Attenborough Tower (L) and Charles Wilson Building (R)

I coordinated the Early Career workshops, where those early in their GIS careers (including, but not limited to, PhD and MSc students) came together for two half-day sessions to find out more about GIS as a career in academia and industry, to learn more and compare notes about their respective PhD/MSc experiences, and most importantly, to get to know each other before the main conference! We had a great variety of input from James Norris (Ordnance Survey / Group on Earth Observations / AGI), James Kendall (RGS), Dave Unwin (ex University of Leicester & Birkbeck), May Yuan (Editor-in-Cheif IJGIS, University of Texas at Dallas), Addy Popy (ESRI UK) and Katie Hall (ESRI UK).

Early Careers session in full flow

The main conference had a great selection of talks and presentations covering every application of GIS from archaeology, to crime, health, transport, and urban studies! It is always a challenge to work out which of the three parallel sessions to attend, and I can’t attend everything. Particularly of note for me was Alex Singleton’s keynote on ‘Why Open Data are Not Enough’, discussing some of the issues with open spatial data, particularly in terms of data longevity which very much reminds me of this XKCD comic, and still really hasn’t been solved for spatial data. This was rather well illustrated by the CDRC Data Store that has been developed through the Consumer Data Research Centre; there is no mechanism for ensuring this continues after the CDRC funding finishes, and this is the norm with many academic projects.

Alex Singleton: Why Open data are Not Enough

There was also a great presentation by Sam Cockings looking at how we can better model day time populations, from a variety of data sources. Integrating many real time data sources is going to be a key aspect of spatial data management in the future and I can see many projects using the skills and technologies Sam described.

Next year GISRUK 2019 will be in Newcastle University, and I look forward to seeing you there!

If you would like a chat about GIS Research, or GIS Training for small groups, please do email nick@geospatialtrainingsolutions.co.uk or give me a call on 01209 808910.

Cross-posted at http://www.geospatialtrainingsolutions.co.uk/gisruk-2018-a-return-to-leicester/.

FOSS4G UK 2018: A success!

After 6 months or so of collaboration FOSS4G UK 2018 finally happened! I was a small part of the dedicated team who brought the conference together and it was an amazing experience. Thanks to James (@JamesLMilner), Tom (@tomchadwin), Isabel (@IsaUlitzsch), Sam (@SamRFranklin), Max (@GeospatialMax) and Dennis (@goldrydigital) as well as Jo Cook and Steve Feldman who gave us occasional nudges in the right direction with their experience from FOSS4GUK 2016 Southampton. Organising the conference felt a bit like organising a wedding(!) in that once we had picked the date, location, catering and sorted out the guest list, the rest more-or-less fell into place! Not that I intend to do either again in the near future!

FOSS4G UK 2018 Team Photo

Unfortunately I wasn’t around for the team photo on Friday, but I was there in spirit!

The conference itself went amazingly well and it was great to see so many people there who were so enthusiastic about open source geospatial software. Unfortunately I was only able to attend Thursday, but I managed to take part in some great workshops on pgRouting and Satellite Data, learn some new things, make some new contacts and baby sit the room-to-room live feed!

MacGyver putting in an appearance at FOSS4GUK 2018 in Mathilde Ørstavik’s Keynote talk on Extracting intelligent information from aerial images using machine learning.

It was a struggle to work out which stream to attend and I’ve seen from Twitter (#FOSS4GUK) that Tom Armitage went to town with the ‘May the FOSS be with you’ Star Wars theme, the highlight being a presentation using a light sabre rather than a laser pointer:


I still hope to have a run through of Tom’s workshop material when I get some time 🙂

FOSS4G UK 2018 Workshop

Everyone hard at work in the pgRouting, PostGIS and QGIS workshop.

We will post links to all the slides and material we can on the website – if yours are not there yet, send them over or submit a PR. I do hope we can do this again, and if people would like to volunteer for the next conference, please make yourself known!

If you’d like a chat about potential for OS Geo training for individuals or groups, please do send me an email nick@nickbearman.me.uk or give me a call on 07717745715.

Spatial Data and Spatial Analysis Training in Southampton

Over three days in January, Nick ran a series of one day GIS training sessions for the ADRC-E at the University of Southampton. The courses covered a whole range of GIS skills including understanding spatial data, finding GIS data, working with QGIS & R, and spatial analysis in GeoDa & R. The course participants came from a wide variety of backgrounds including PhD students; academics; health; economics; business intelligence and national statistics.

As well as plotting data on a map, the courses also covered more advanced spatial analysis, looking at buffers, spatial overlays, spatial decision making and spatial statistics. This allowed participants to get the most from their spatial data and use it in their future work.

GIS is a fantastic tool and something that can be applied in many different settings. Nick’s up-to-date knowledge and experience provides course attendees with the know-how needed to evaluate their own data, to create maps and perform the analysis within their workplace.


Photo credit: ADRC-E

“I enjoyed the focus on practical exercises – very useful! Excellent content for intro course.” course attendee, Introduction to QGIS: Understanding and Presenting Spatial Data, 15th January 2018.

We run courses across the UK, our training page provides details of our upcoming courses. If one-to-one GIS training would be useful for you or members of staff in your organisation, please have a look at our brochure or get in touch to find out more about our tailored courses for all skill levels.

TEDx Truro – Beyond Barriers

On a sunny Friday at the end of half term, Nick attended the TEDx Truro event, ‘Beyond Barriers’ running at Truro and Penwith College. TEDx events are the ‘little brothers’ of the main TED events, the world famous series of short videos given in the area of Technology, Education and Design under the banner ‘Ideas worth spreading’.

TEDx events are independently organised and the Truro event is in its second year, with a sell-out crowd of 250 attendees. This years talks covered a really wide range of topics, covering everything from dyslexia, gender dysphoria, mental health, sex work, to biochemistry, depression, robots and artificial intelligence.

There was an amazing buzz in the auditorium, this continued during the breaks; there was idea sharing, discussions and even a selfie with some local celebrities! It was a great networking opportunity, meeting people from Software Cornwall, Pirate FM, Plymouth University and a whole host of local SMEs.

The talks around the area of mental health particularly resonated, with both Will Coleman (from Golden Tree Productions, famous for being the driving force behind The Man Engine) and Emma Wright (working for a national cancer charity in Cornwall) talking about how they had often presented one face to the world at large, but at times had another that truly reflected their feelings and experiences, which very few people saw. Many other speakers also discussed mental health in passing, and it is vital for mental health to be discussed more openly and easily than it is at the moment.

TEDx was organised by a great group of volunteers, so many thanks to them for organising everything and making it run smoothly. They are already planning for next year – head over to http://tedxtruro.com to find out what it’s all about, and we hope to see you there next year!

Cross-posted at http://www.clearmapping.co.uk/our-blog/item/492-tedx-truro-beyond-barriers.html

Introduction to GIS and Confident Spatial Analysis, UCL, London

During a warm week in July, I spent three days at UCL in London running GIS courses in conjunction with Clear Mapping Co, the ADRC-E (Administrative Data Research Centre for England) and the CDRC (Consumer Data Research Centre). We ran three one day courses, developing the courses we had run at UCL in February. It was great to come back and increase the number of people who could benefit from using GIS and spatial data in their work.

We had a wide range of participants, from PhD students and researchers, to those working in Government, charities and a wide variety of other applications. We even had someone who was making the leap from working for a large commercial company to going freelance at the end of July – good luck!

Our colouring in exercise was a great success and really got the students thinking about how we choose the colours we use on a choropleth map, as well as how we select the classification boundaries for the data. We gave the students one data set, and the 20 students created 20 different maps. The lesson was to make sure you think about which colours and classifications you choose – don’t just stick with the defaults your GIS program gives you. They are always not the best!

During these and other courses, we found a few people who had experimented with the ggmap/ggplot2 libaries for making maps in R, in addition to the base R plot commands (which I tend to teach). I know there is quite a division between ggplot users and base plot users (see here https://flowingdata.com/2016/03/22/comparing-ggplot2-and-r-base-graphics/ for a good comparison) and while there are many pros and cons to each system, and some very good examples out there (https://rstudio-pubs-static.s3.amazonaws.com/79029_b56eaffe36ef44f29b8efc0a07d67208.html). I’ve not yet come across a pros and cons article for spatial data. Does anyone know of one?

It’s always great teaching GIS to people who haven’t used it before. There is so much potential with spatial data; for more information about the GIS courses we can offer and how GIS could be useful for you, take a look at our ISSUU or get in contact with Nick who will be able to develop a bespoke course suited to your requirements. Email Nick at nick@clearmapping.co.uk, or call 01326 337072.

Cross-posted at http://www.clearmapping.co.uk/our-blog/item/490-introduction-to-gis-and-confident-spatial-analysis-ucl-london.html.

HERG Writing Retreat at Dartington Hall

Over a fresh, sunny three days in early January, I joined 17 academic writers at Dartington Hall, Totnes for a writing retreat. What is a writing retreat, I hear you ask? Well, for academics working at a university, one of the key ways of conveying findings from their research is by writing papers that are published in academic journals. Writing these papers (often 5000 – 8000 words long) is a very time intensive task and also often key to promotion up through the university structure.

m00265_header_hall

Writing a paper can be a lonely task and is often something that gets pushed down people’s to do lists, because usually there are no specific deadlines, other than the ones you invent yourself (which are easily changed!). At the session we had participants with a range of experience, from PhD students writing their first or second paper, to experienced academics writing their thirtieth paper!

We used the opportunity to support each other by sharing ideas about writing processes, where to start and how to make the best use of the time available. We also had dedicated writing sessions (either 60 or 90 minutes) where we worked in the same room on our individual papers. This was a very new experience for me, and the “peer” pressure of everyone else writing (and not checking emails, Facebook etc.) for a specific period worked very well.

m00265_picture_hall

I was writing up an article on how we can ensure research is reproducible, using our recent PopChange project as an example. I hope to be presenting the research at the GISRUK conference in Manchester in March and will be submitting the paper for publication soon after!

My thanks go to Sarah Dyer and Dave Simm of the Higher Education Research Group for the Royal Geographical Society who organised the writing retreat and made sure everything ran to plan.

Cross-posted from http://www.clearmapping.co.uk/our-blog/item/475-herg-writing-retreat-at-dartington-hall.html

Creating choropleth maps in R with the darkest colour at the top

I’ve just been through the process of contributing to the source code of a package in R (in a very small way) so here’s a short piece on how easy it was, and why anyone can do it! I originally wrote this post in August last year, but waited to post it until the new version of maptools was released. I missed this (we are now at 0.8-39!) and have only just rediscovered this post. It’s all still relevant though!

I have been using the Maptools library extensively in my use of R as a GIS, as well as in my teaching material (hosted at https://github.com/nickbearman/intro-r-spatial-analysis). The default plot order in the legend is to have the darkest colour at the bottom of the legend, and the lightest colour at the top. This was just something I accepted, and to be honest, never really thought about before.

I recently delivered a training course on R to some staff at the ONS (Office for National Statistics, England & Wales) and they said that their best practice guidelines are to have the darkest colour at the top of the legend. They asked me how to do this, which I didn’t know!

After some fiddling about with an R script, I created a version which worked for them. I then thought it might be useful to integrate this into the Maptools library, and emailed the package author, Roger Bivand. He was very helpful, and I added the additional code to the sourcefiles for Maptools. These are now avaliable in version 0.8-37 (or later), which has recently be released. Running update.packages(“maptools”) should get you the new version.

To reverse the colours is a simple matter of changing the legend code in two places. Using the example from the helpfile, the original line:

legend(x=c(5.8, 7.1), y=c(13, 14.5), legend=leglabs(brks), fill=colours, bty="n")

The revised line:

legend(x=c(5.8, 7.1), y=c(13, 14.5), legend=leglabs(brks, reverse = TRUE), fill=rev(colours), bty="n")

To give you some nice visual examples:

Rplot Rplot_reverse

Or for those of you who have attended my R course:

normal-order reverse-order

The file I updated is at https://r-forge.r-project.org/scm/viewvc.php/pkg/R/colslegs.R?view=markup&root=maptools (this link shows the changes), and I also updated the helpfile. If you’ve done some R scripting, then it is not too difficult to do. Any questions, please post them here. Good luck!


Joining Clear Mapping Co

I’ve formally joined Clear Mapping Co, moving from academia to the commercial world. Below is a copy of their most recent blog post.

20131005_082255We are pleased to announce that Dr Nick Bearman has formally joined Clear Mapping Co as Senior GIS Analyst and Course Director. Nick joins us at a key point in the company’s development in our fifth year, as we continue to expand into international markets with our unique offer of cartographic design consultancy. Nick is continuing to work on cartographic projects, whilst also developing our new range of GIS Training Courses, available at different universities around the country.

He brings a wealth of experience having lectured and researched at University of Liverpool for nearly three years. We are really pleased to welcome him on board and hope you’ll get to meet him at future events.

Q1. What brings you to Cornwall?

My wife and her family live in Cornwall, so was keen to get back to Cornwall after lecturing and researching in Liverpool for nearly 3 years. I’ve always wanted to explore options outside academia and experience a different set of challenges.  Clear Mapping Company was a perfect opportunity for me, both in terms of applying and developing my skills, as well as spearheading their GIS training development.

Q2. Where did you study?

Studied at Leicester and UEA (Norwich) Universities and enjoyed everything about it. At school I really enjoyed geography and computer science and when I discovered the Geographic Information Systems (GIS), it was the ideal combination of the two! I still have connections with Leicester and UEA as well as Exeter and Bristol in the south west, but I’ll be pleased to be based in Cornwall.

Q3. What areas of GIS do you work with?

GIS is such a broad area that it is tricky to pin down exactly which areas I work in, and my recent projects have involved UK Census data (going back to 1971), transport routing analysis (using OpenStreetMap data) and web GIS (using the Google Maps API, among others). I use a range of different tools and techniques, depending on which is most appropriate for the project.

Q4. What do you find exciting about working in an international cartographic design consultancy?

Have been working with Caroline & Kirstin at Clear Mapping Co for the past five months and really enjoying it. I’ve been involved in a wide variety of projects, including campsite maps, 3D battlefield education maps and phase 1 ecology studies. The company is growing and we recently advertised for a Senior Graphic Designer. I have a significant input into the direction the company takes, which is both exciting and scary! We are also based in a beautiful location in Penryn, Cornwall with a lovely view looking out on to the Penryn river! Cornwall has some spectacular scenery and we’re really fortunate to have Cornwall as our base.

Q5. What do you regret about moving away from academia?

Leaving academia after spending many years studying & teaching does make me feel a little sad, but also excited to be working in a very different environment will all sorts of different opportunities and challenges. While there are quite a few differences, one thing that has slightly surprised me is the number of similarities.

In academia, particularly as a GIS specialist, I often had to liaise between different members of staff who wanted to perform some GIS analysis on their project, and explain what GIS could do and equally make it clear what GIS could not do. This was particularly important when I was working in interdisciplinary groups, ensuring we were all speaking the same language, particularly when using terms like rate analysis, difference and spatial scale. This is equally important in a commercial setting, as often the client doesn’t know exactly what they want and what can (or cannot) be done.

One of the biggest differences I have found is the time scales – in academia we are used to planning 6 months, 1 or 2 years ahead (REF2020 anyone?!) whereas in commercial work what we do changes on a weekly, daily or even hourly basis. New projects come in and often have to be dealt with immediately, and sometimes can be out the door the same day or the next day. Getting to grips with this has been one of the hardest things for me so far, but I am getting used to it!

Q6. Why does GIS Training give you a buzz?

I really enjoy teaching people about the power of GIS and to show them how it can be useful for their work. That ‘moment’ where people who haven’t used spatial data before see what it can do for them is amazing. Often many people on my courses have come across or used GIS before, but they don’t understand how to get the most from it. It’s really amazing to get them to use GIS on a regular basis, and can make a real difference to their work.

Q7. Who in the sector would you like to meet? And what would you say if you met them?

Would love to meet the development team of Google Earth (originally Keyhole, Inc.) and whoever in Google decided to buy and make Google Earth available across the planet. The public release of Google Earth completely transformed the public’s perception and understanding of spatial data, and is also probably a big factor in the release of a large number of spatial data sets through the Open Data movement. Aside from the obvious questions: “Did you know it was going to be that successful?” and “Did you get enough money from Google for it?(!)”, I’d like to ask how they would redesign it to make it a more successful educational tool to highlight the power of spatial data and GIS.

It would also be great to talk to Jack and Laura Dangermond, founders of ESRI, the company behind one of the biggest commercial GIS systems, ArcGIS. I’d like to ask them about how the explosion of spatial data has impacted their original plans for ArcGIS and how all sides of the geospatial community could work together to promote the use of teaching and the uptake of GIS.

If you would like any further information about the training courses Nick will be offering or his work as a Senior GIS analyst, then please contact Kirstin or Nick on 01326 337072 or email us at hello@clearmapping.co.uk.

R for Spatial Analysis Courses in Liverpool and London

This week I have run two courses on ‘Introduction to Using R for Spatial Analysis’ which have been very successful. Both courses sold out, with 15 people attending in Liverpool and 20 in London. We had people with a wide range of GIS and R experience, ranging from no experience in either GIS or R, to significant experience in one but little in the other.

2015-12-02 11.34.09We covered the basics of using R through the RStudio interface, which I find makes R easier to understand for newbies! I certainly found it much easier to learn R using RStudio, and still use it everyday for my R work (I’ve opened the native R interface maybe twice since I started using it!). We also looked projections and coordinate systems (which were at the bottom of a GIS problem a colleague had today) and at spatial data representation, particularly how to create a representative, truthful choropleth map, and I made use of a blog post about this very issue, which I recently tweeted.

2015-12-02 11.34.21We also had a number of very interesting discussions about the pros and cons of R vs other GIS software, such as ArcGIS or QGIS, as well as other languages, such as Python. Each has their own pros and cons, and in my work I regularly use a mix of these, depending on what I am trying to achieve.

 I am also in the process of developing an intermediate course that will focus more on spatial analysis. If you are interested in finding out more about when either the basic or the intermediate courses will be run again, please send me a message (using the contact form on this site) and I will add you to a list to hear about future courses.

All of the material from this course is freely available, and hosted on GitHub. Head over to http://github.com/nickbearman/intro-r-spatial-analysis and you can view the material yourself and work through it at your own pace. You can even use it to contribute to new teaching material, and if you do, please also make your material available through Creative Commons so others can benefit from it as well.

Cross-posted at http://geographicdatascience.com/blog/training/R-for-Spatial-Analysis-Courses-in-Liverpool-and-London/.