I’ve just been through the process of contributing to the source code of a package in R (in a very small way) so here’s a short piece on how easy it was, and why anyone can do it! I originally wrote this post in August last year, but waited to post it until the new version of maptools was released. I missed this (we are now at 0.8-39!) and have only just rediscovered this post. It’s all still relevant though!
I have been using the Maptools library extensively in my use of R as a GIS, as well as in my teaching material (hosted at https://github.com/
I recently delivered a training course on R to some staff at the ONS (Office for National Statistics, England & Wales) and they said that their best practice guidelines are to have the darkest colour at the top of the legend. They asked me how to do this, which I didn’t know!
After some fiddling about with an R script, I created a version which worked for them. I then thought it might be useful to integrate this into the Maptools library, and emailed the package author, Roger Bivand. He was very helpful, and I added the additional code to the sourcefiles for Maptools. These are now avaliable in version 0.8-37 (or later), which has recently be released. Running update.packages(“maptools”) should get you the new version.
To reverse the colours is a simple matter of changing the legend code in two places. Using the example from the helpfile, the original line:
legend(x=c(5.8, 7.1), y=c(13, 14.5), legend=leglabs(brks), fill=colours, bty="n")
The revised line:
legend(x=c(5.8, 7.1), y=c(13, 14.5), legend=leglabs(brks, reverse = TRUE), fill=rev(colours), bty="n")
To give you some nice visual examples:
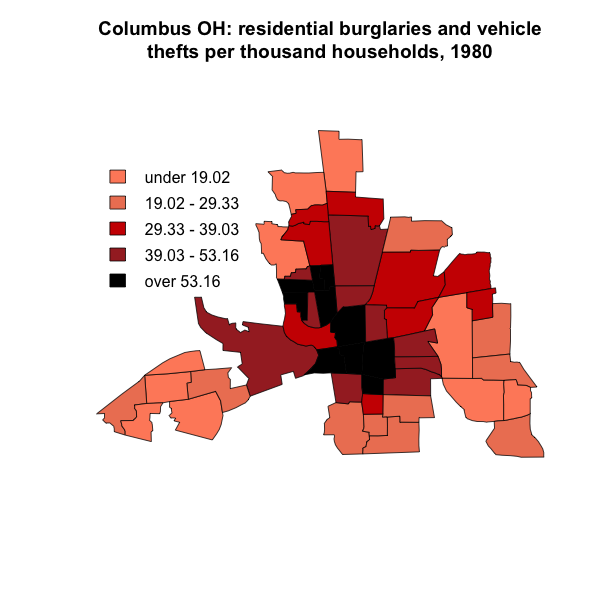

Or for those of you who have attended my R course:


The file I updated is at https://r-forge.r-project.org/scm/viewvc.php/pkg/R/colslegs.R?view=markup&root=maptools (this link shows the changes), and I also updated the helpfile. If you’ve done some R scripting, then it is not too difficult to do. Any questions, please post them here. Good luck!
Hi Nick,
This is really useful thank you! On a slightly unrelated note, do you know how I would go about adding another legend label to the legend. My data has a lot of N/As and when I plot this it just leaves white gaps in the map but I would like to be able to label that this missing data.
It would be much appreciated if you could help!
Thank you!
Hi Isi,
Thanks very much – I’m glad you found it useful. In terms of adding a extra legend, I think you can just call the legend() function again and say legend(x, y, “Text you want”, fill = X, col = X, …) to add the extra information. The help (?legend) has some info and this post has some info on the basic legend function. Have a go and let me know how you get on!
Good luck!
Nick.