We have recently published a paper in the Journal of Transport and Health where we modelled the impact on CO2 emissions of an increased uptake of active travel for the home to school commute. The paper is freely available to anyone under Gold Open Access, with a CC-BY Attribution license.
One of the challenges in this paper, building upon (Singleton, 2014) was being able to model individual routes from home to school for all ~7.5 million school children in England. In addition to origin and destination locations, we also know what modes of travel are typically used to get to school, thanks to the School Census (also known as the National Pupil Database). While modelling a small number of routes is relatively straight forward to perform within a GIS, the challenge was to complete the routing for all 7.5 million records in the data set.
To calculate the route, we used a combination of two different pieces of software – Routino and pgRouting. Routino allows us to use OpenStreetMap data to derive a road-based route from given start and end points, using a number of different profiles for either car, walking, cycling or bus. The profile used is important, as it allows the software to take into account one-way streets (i.e. not applicable to walking, but applicable to driving), footpaths (i.e. applicable to walking only), cycle lanes, bus lanes, etc.. The screenshot below shows an example route, calculated by Routino.
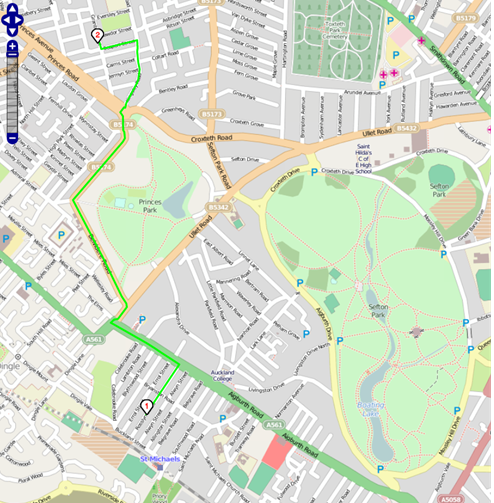
Example of the route calculated using Routino for a car travelling from Rosslyn Street (1) to Granby Street (2). © OpenStreetMap contributors, http://www.openstreetmap.org/copyright.
For railway, tram or tube travel, this was implemented using pgRouting from both Ordnance Survey and edited OSM data. The different networks were read into the PostgreSQL database, and routes calculated using the Shortest Path Dijkstra algorithm. This returned a distance for the route, which was stored alongside the original data.
Routino and pgRouting were called using R, which also managed the large amounts of data, subsequently calculated the CO2 emissions model, and created graphical outputs (see below).

Map of CO2 emissions (grouped by residence LSOA) for Norfolk.
To run the routing for each pupil for four years worth of data (we had data from 2007/8-2010/11, although we only used data from academic year 2010-2011 in the paper) took about 14 days on my 27″ iMac. We considered using a cloud solution to shorten the run times, but given we were using sensitive data this was deemed too problematic (see related blog post from Alex on this). This work highlights that it is possible to perform some types of big data analysis using a standard desktop computer, which allows us to perform this type of analysis on sensitive data without needing to make use of cloud or remote processing services, which are often not compatible with restrictions on sensitive data.
*As you would expect, the postcode unit is sensitive data and we had to apply to the Department of Education to use this data. Any postcodes or locations used in this blog post will be examples – e.g. L69 7ZQ is the postcode for my office!
Singleton, A. 2014. “A GIS Approach to Modelling CO2 Emissions Associated with the Pupil-School Commute.” International Journal of Geographical Information Science 28 (2): 256–73. doi:10.1080/13658816.2013.832765.
Cross-posted from http://geographicdatascience.com/r/2014/11/20/Home-School-Routes/